We may earn money when you click on links to our partners. Advertiser Disclosure

Best U.S. Cities for Small Business
A Data-Driven Look at Where Small Businesses Thrive in 2026
Whether you’re a long-time entrepreneur or just beginning your journey, choosing the best place to start your ventures is crucial.
The B2B Reviews team has previously examined the best states for starting a business. Now, we’re taking a closer look at the nation’s most populous cities to determine which ones are best suited for small businesses.
To determine which U.S. cities are best in 2026, we identified some of the most populous cities in all 50 states and compared them across six key metrics important to business growth and survival.
For a more in-depth look into how we determined our top cities, take a look at our methodology.
Key Insights
- Manchester, New Hampshire, has an average commercial rent of $12.58, which is less than the national average of $32.77 and more affordable than 92% of the cities on our list. Additionally, 70.5% of the civilian population is in the labor force, which is higher than 91% in the cities on our list.
- Lowell contributed 0.083% to Massachusetts’ gross domestic product (GDP), ranking it with the top 6% of cities on our list for this metric.
- In Bellevue, Nebraska, 70.7% of the population is in the labor force—which is higher than the national average of 63%—ranking it in the top 10% for this metric.
- The average commercial rent in South Portland, Maine, is $14.66 per square foot, placing it among the top 20% of cities with the lowest rents.
Top 10 U.S. Cities for Small Business
Explore the best ten cities in the United States for small businesses in 2026 in more depth.
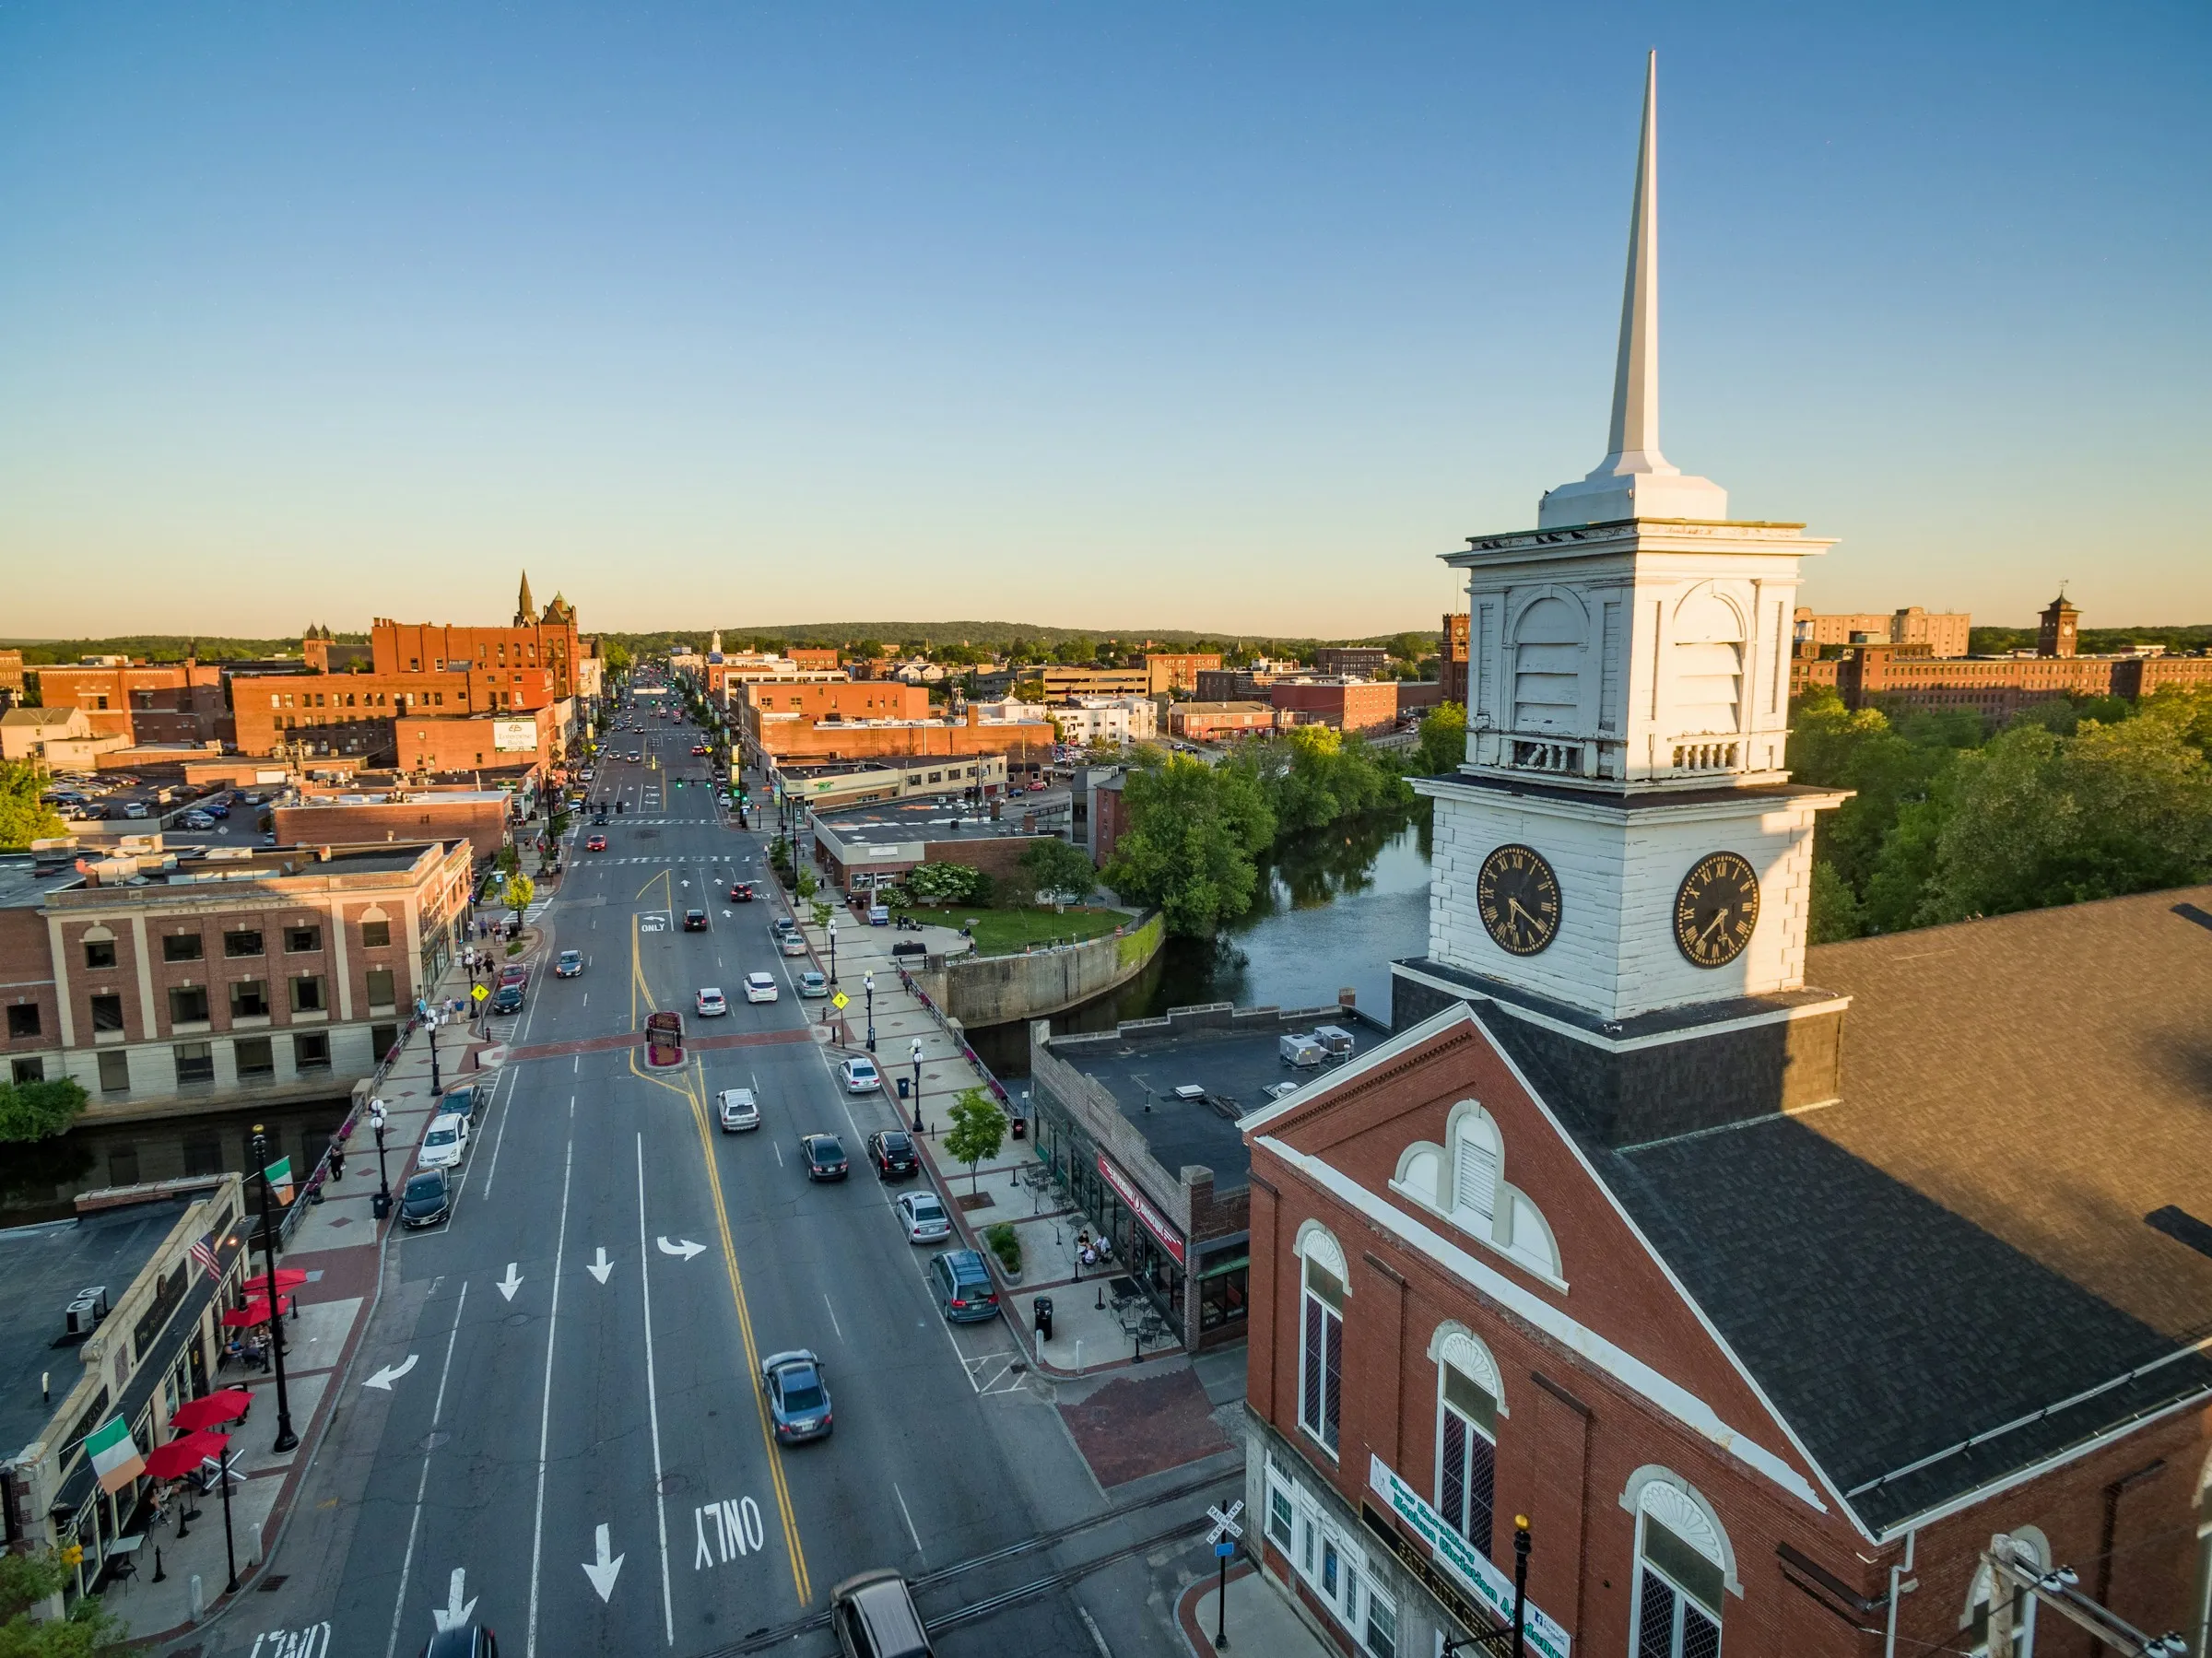
Photo by Seth Dewey on Unsplash
1. Manchester, New Hampshire
Manchester, New Hampshire, takes first place for the best U.S. cities for small businesses. The city is among the top 10% of cities on our list with the lowest commercial rents per square foot. The average rent for commercial real estate in Manchester, NH, is $12.58, significantly lower than the national average of $32.77. Additionally, the city has a 0% sales tax rate, which is far less than the national average (7.52%).
The median household income in Manchester, NH, is $95,112, higher than the national average of $75,149. When looking at workforce factors, 40.6% of the population in Manchester, NH, has a Bachelor’s degree or higher, beating the national average of 35%. Finally, 70.5% of the civilian population (16 years and up) is part of the labor force, which is more than 91% of the cities on our list.
2. Lowell, Massachusetts
Coming in second place is Lowell, Massachusetts. The city has an average commercial rent of $20.26 per square foot, which is lower than the national average of $32.77. Lowell contributed 0.083% to Massachusetts’ gross domestic product (GDP), which is higher than the average of the cities on our list (0.037%). The combined city and state sales tax rate is 6.25%, which is lower than the national average (7.52%).
The median income for households in Lowell, MA, is $121,304, the fifth-highest on our list and significantly higher than the national average of $75,149. In Lowell, 59% of the population has a Bachelor’s or higher, and 69.8% of the population is in the labor force, beating the national averages of 35% and 63% respectively.
3. Bellevue, Nebraska
In third place is Bellevue, Nebraska. It has an average commercial rent of $15.46 per square foot, more than half the national average of $32.77. Bellevue contributed 0.051% of Nebraska’s GDP, higher than the list average of 0.037%. It also has a lower-than-average sales tax rate of 7.00%.
The median household income in Bellevue, NE, is $95,911—higher than the national average of $75,149. In Bellevue, 41.9% of the population has a Bachelor’s degree or higher, and 70.7% are in the labor force, both higher than the national averages of 35% and 63%, respectively.
4. South Portland, Maine
Taking forth place is South Portland, Maine, offering an average commercial rent of $14.66 per square foot, lower than the average of $32.77, placing it among the top 20% for lowest rents. South Portland contributed 0.052% of Maine’s GDP, which is higher than the list average of 0.037%.
Additionally, the median household income in South Portland, ME, is $87,710, which is more than the average of $75,149. Regarding the city’s population, 52.2% have a Bachelor’s degree or higher, which is higher than the national average of 35%. Finally, 67.8% of the population is in the labor force, more than the national average of 63%.
5. Olathe, Kansas
Olathe, Kansas, comes in fifth place for the best U.S. cities for small business. The commercial rent per square foot is $19.79, which is lower than the national average of $32.77. Additionally, Olathe contributed 0.081% to Kansas’s GDP, ranking it in the top 10% of cities on our list.
The median household income in Olathe, KS, is $103,644, which is higher than 93% of the cities on our list and more than the national average of $75,149. Additionally, 56.9% of the population has a Bachelor’s degree or higher (above the national average of 35%), and 71.7% of the population is in the labor force, exceeding the national average of 63%.
6. Aurora, Illinois
Aurora, Illinois, comes in sixth on our list, with a commercial real estate rent of $17.66 per square foot, below the national average of $32.77. The city contributed 0.081% to the state’s GDP, which places it in the top 10% of the cities on our list for that metric.
The median household income is $107,035, exceeding the national average of $75,149 and ranking it above 94% of the cities on our list. Aurora has a higher-than-average (35%) percentage of citizens with a Bachelor’s degree or higher at 51.4%, as well as a higher-than-average (63%) percentage of labor force participants at 68.3%.
7. Nashua, New Hampshire
Ranking seventh on our list is Nashua, New Hampshire. The city offers businesses an average commercial real estate rent of $16.54 per square foot, which is lower than the national average ($32.77). Additionally, Nashua, NH, has a 0% sales tax rate, significantly lower than the national average of 7.52%.
For those living in Nashua, the median household income is $95,112, which is higher than the national average household income of $75,149. Finally, 40.6% of the Nashua population has a Bachelor’s degree or higher, more than the national average of 35%, and 70.5% of the population is in the labor force, exceeding the national average of 63%.
8. Minneapolis, Minnesota
Minneapolis, Minnesota, comes in eighth on our list. The average commercial rent is $18.18 per square foot, which is less than the national average of $32.77. Minneapolis accounted for 0.073% of Minnesota’s total GDP, more than the average for the cities on our list (0.037%).
The median household income in Minneapolis is $92,595, which exceeds the national average of $75,149. The percentage of the population with a Bachelor’s or higher is 53.3%, which is higher than the national average (35%). Finally, 71.4% of Minneapolis’s population is in the civil labor force, higher than the national average of 63%.
9. Hillsboro, Oregon
Coming in ninth is Hollsboro, Oregon, with an average commercial real estate rent of $18.45 per square foot, below the national average of $32.77. Hillsboro contributed 0.069% of Oregon’s GDP, which is more than 83% of the cities on our list. Also, both the city and the state have a 0% sales tax.
The median household income in Hillsboro, Oregon, is $100,121, ranking it within the top 10% of cities on our list. Hillsboro also has a higher-than-average percentage of people with a Bachelor’s degree or higher (46.7%), as well as a higher-than-average percentage of people in the civilian labor force (68.7%).
10. Naperville, Illinois
Completing our list in tenth place is Naperville, Illinois. The city has an average commercial rent of $19.28 per square foot. Naperville accounted for 0.081% of Illinois’s GDP, which is higher than 93% of the cities on our list.
Naperville has a higher-than-average median household income of $107,035, ranking it among the top 6% of cities on our list for that metric. The city also has a higher-than-average percentage of people with a Bachelor’s degree or higher, at 51.4% (the national average is 35%). Finally, 68.3% of the population is in the labor force, which is higher than the average (63%).
Methodology
To find the best U.S. cities for small businesses, B2B Reviews gathered a list of the most populous cities in all fifty states, based on the latest data from the United States Census Bureau.
We then compared the 236 cities across six key metrics, focusing on financial, workforce, and consumer aspects important to business growth. Each city earned a score based on a weighted value. Once compiled, all cities received a final weighted score and were ranked accordingly.

Photo by Tomas Williams on Unsplash
Commercial Rent Per Square Foot—Total 20 Points
The B2B Reviews research team used data from leading commercial real estate marketplaces to find the average cost of commercial real estate per square foot in each city. Cities with a lower average cost earned more points.
Percentage of State GDP—Total 15 Points
Using the most recent data available from the Bureau of Economic Analysis, we found the gross domestic product (GDP) of each city and compared it to the GDP of the corresponding state, calculating the percentage of the city’s contribution. Cities with a higher percentage scored higher.
City & State Sales Tax—Total 5 Points
Sales tax impacts small businesses by creating administrative burdens and compliance costs, as businesses must collect both city and state taxes to remain compliant. We added each city’s sales tax rate to the state sales tax rates to find the combined rate. Cities with a lower sales tax rate ranked higher.
Median Household Income—Total 23 Points
A higher median household income indicates a greater spending power for customers. Using the latest data from the U.S. Census Bureau, we found the median household income of each city’s county. Areas with a higher median household income earned more points.
Percentage of Population with Bachelor’s or Higher—Total 17 Points
To gain insight into the available workforce, the B2B Reviews team gathered the latest data from the U.S. Census Bureau to determine what percentage of that city’s population has a bachelor’s degree or higher. Cities with a higher percentage scored better.
Civil Labor Force Percentage—Total 20 Points
Using U.S. Census Bureau data, we found the percentage of the population (16 years and older) participating in the civilian labor force for each city. Higher percentages earned the city more points.
The Bottom Line
Starting and growing your business in the right city makes all the difference. Whether you value low commercial rent, a robust local economy, or a large, educated workforce, the cities on our list are promising markets.
Consider the following factors to ensure a location is the best environment for your business:
- Affordable Real Estate: An affordable commercial space for your business is crucial, as it reduces overhead and frees up capital for growth, innovation, and investment.
- Economic Contribution (GDP Share): Generally, cities that contribute more to their state’s GDP may provide greater access to business-friendly policies, investment opportunities, and financial incentives.
- Healthy & Affordable Economy: Cities with a higher median household income often mean customers have more money to spend at local businesses; lower sales tax rates also reduce financial burdens on businesses and buyers.
- Quality Labor Market: Cities with larger workforce participation and education levels offer businesses a wide range of skilled workers across all ages and backgrounds.
If any city on this list looks interesting to you, the next steps you should take are researching local resources, networking opportunities, and the consumer markets. It’s important to select the right environment for your business, as it can turn your vision into reality.
Fair Use Statement
If our findings interest you, feel free to share the data story with others; however, please provide a link back to this article so readers can access our full methodology.
Explore the Best Cities by State
Data used to create our rankings were collected from the following sources:
- Avalara, Inc., “2025 U.S. sales tax rates by state.” Accessed January 5th, 2026.
- Bureau of Economic Analysis, “CAGDP1 County and MSA gross domestic product (GDP) summary.” Accessed January 7th, 2026.
- CommercialCafe: Yardi Systems, “Commercial Listings.” Accessed January 6th, 2026.
- United States Census Bureau, “Median Household Income by County in the United States and Puerto Rico.” Accessed January 6th, 2026.
- United States Census Bureau, “QuickFacts.” Accessed January 6th, 2026.